Quality. The term Quality in the context of correspondence analysis pertains to the quality of representation of the respective row point in the coordinate system defined by the respective numbers of dimensions, as chosen by the user. The quality of a point is defined as the ratio of the squared distance of the point from the origin in the chosen number of dimensions, over the squared distance from the origin in the space defined by the maximum number of dimensions (remember that the metric in the typical correspondence analysis is Chi-square). By analogy to Factor Analysis, the quality of a point is similar in its interpretation to the communality for a variable in factor analysis.
A low quality means that the current number of dimensions does not represent well the respective row (or column).
Quality Control. In all production processes, the extent to which products meet quality specifications must be monitored. In the most general terms, there are two "enemies" of product quality: (1) deviations from target specifications, and (2) excessive variability around target specifications. During the earlier stages of developing the production process, designed experiments are often used to optimize these two quality characteristics (see Experimental Design); the methods discussed in the Quality Control chapter are on-line or in-process quality control procedures to monitor an on-going production process.
The general approach to on-line quality control is straightforward: We simply extract samples of a certain size from the ongoing production process. We then produce line charts of the variability in those samples, and consider their closeness to target specifications. If a trend emerges in those lines, or if samples fall outside pre-specified limits, then we declare the process to be out of control and take action to find the cause of the problem. These types of charts are sometimes also referred to as Shewhart control charts (named after W. A. Shewhart who is generally credited as being the first to introduce these methods; see Shewhart, 1931).
For more information, see the Quality Control Charts chapter.
Quantiles. The quantile (this term was first used by Kendall, 1940) of a distribution of values is a number xp such that a proportion p of the population values are less than or equal to xp. For example, the .25 quantile (also referred to as the 25th percentile or lower quartile) of a variable is a value (xp) such that 25% (p) of the values of the variable fall below that value.
Similarly, the .75 quantile (also referred to as the 75th percentile or upper quartile) is a value such that 75% of the values of the variable fall below that value and is calculated accordingly.
See also, Quantile-Quantile Plots
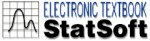
Quantile-Quantile Plots. You can visually check for the fit of a theoretical distribution to the observed data by examining the quantile-quantile (or Q-Q) plot (also called Quantile Plot).
In this plot, the observed values of a variable are plotted against the theoretical quantiles. A good fit of the theoretical distribution to the observed values would be indicated by this plot if the plotted values fall onto a straight line. To produce a Q-Q plot, the program will first sort the n observed data points into ascending order, so that:
x1  x2 ... xn
These observed values are plotted against one axis of the graph; on the other axis the plot will show:
F-1((i-radj) / (n+nadj))
where i is the rank of the respective observation, radj and nadj are adjustment factors ( 0.5) and F-1 denotes the inverse of the probability integral for the respective standardized distribution. The resulting plot (see below) is a scatterplot of the observed values against the (standardized) expected values, given the respective distribution. Note also that the adjustment factors radj and nadj ensure that the p-value for the inverse probability integral will fall between 0 and 1, but not including 0 and 1 (see Chambers, Cleveland, Kleiner, and Tukey, 1983.
Quantile-Quantile Plots - Categorized. In this graph, you can visually check for the fit of a theoretical distribution to the observed data by examining each quantile-quantile (or Q-Q) plot (also called Quantile Plot, see Quantile-Quantile Plots) for the respective level of the grouping variable (or user-defined subset of data).
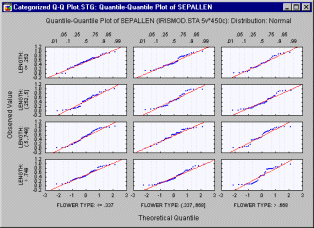
In this plot, the observed values of a variable are plotted against the theoretical quantiles. A good fit of the theoretical distribution to the observed values would be indicated by this plot if the plotted values fall onto a straight line. One component graph is produced for each level of the grouping variable(or user-defined subset of data) and all the component graphs are arranged in one display to allow for comparisons between the subsets of data (categories). (See Quantile-Quantile Plots for more details on how to produce a Q-Q plot.)
Quartile Range. The quartile (this term was first used by Galton, 1882) range of a variable is calculated as the value of the 75th percentile minus the value of the 25th percentile. Thus it is the width of the range about the median that includes 50% of the cases.
For more information, see Nonparametrics
Quartiles. The lower and upper quartiles (this term was first used by Galton, 1882; also referred to as the .25 and .75 quantiles) are the 25th and 75th percentiles of the distribution (respectively). The 25th percentile of a variable is a value such that 25% of the values of the variable fall below that value.
Similarly, the 75th percentile is a value such that 75% of the values of the variable fall below that value and is calculated accordingly.
Quasi-Newton Method. A nonlinear estimation procedure which will, at each step, evaluate the function at different points in order to estimate the first-order derivatives and second-order derivatives. It will then use this information to follow a path towards the minimum of the loss function.
QUEST. QUEST is a classification tree program developed by Loh and Shih (1997). For discussion of the differences of QUEST from other classification tree programs, see A Brief Comparison of Classification Tree Programs.
Quick Propagation.
An heuristic modification of the back propagation algorithm which attempts to use a simple quadratic model of the error surface (calculated independently along each weight) to speed convergence (Fahlman, 1988; Patterson, 1996). See, Neural Networks.